 Catalogue PIGMA
University of Bologna, Department of Physics and Astronomy (DIFA)
Type of resources
Available actions
Topics
Keywords
Contact for the resource
Provided by
Years
Formats
Representation types
Resolution
-
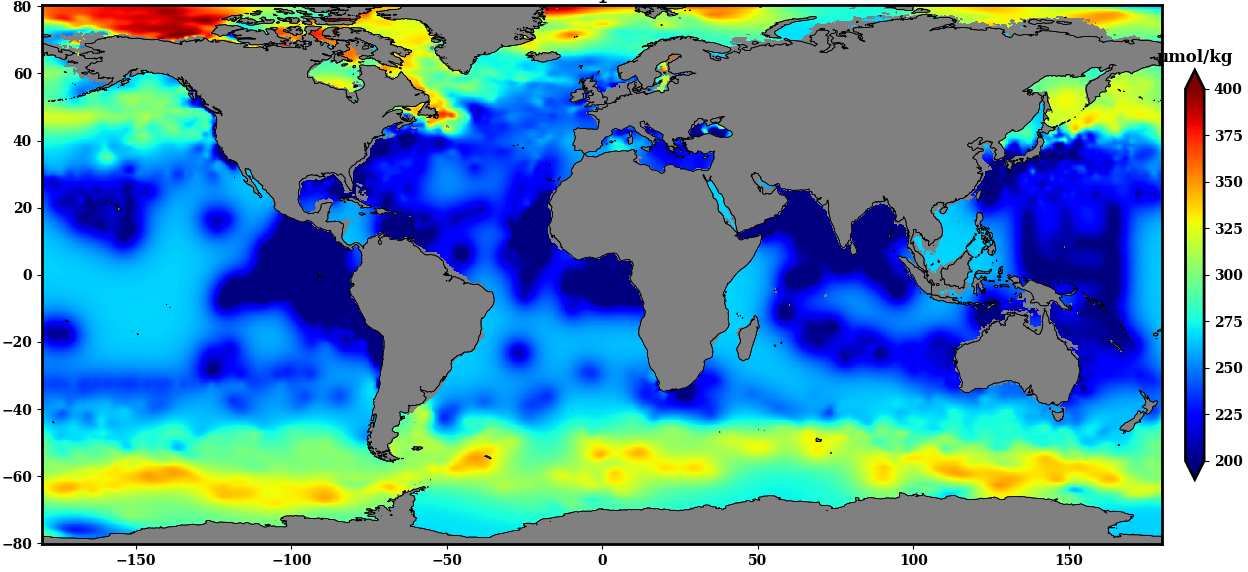
The SDC_GLO_CLIM_O2_AOU product contains two different monthly climatology for dissolved Oxygen and Apparent Oxygen Utilization, SDC_GLO_CLIM_O2 and SDC_GLO_CLIM_AOU respectively from the World Ocean Data (WOD) database. Only basic quality control flags from the WOD are used. The first climatology, SDC_GLO_CLIM_O2, considers Dissolved Oxygen profiles casted together with temperature and salinity from CTD, Profiling Floats (PFL) and Ocean Station Data (OSD) for time duration 2003 to 2017. The second climatology, SDC_GLO_CLIM_AOU, apparent Oxygen utilization, is computed as a difference of dissolved oxygen and saturation O2 profiles. The gridded fields are computed using DIVAnd (Data Interpolating Variational Analysis) version 2.3.1.
-
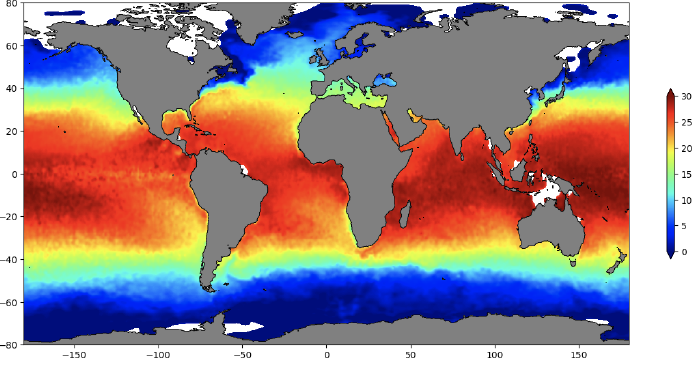
The SDC_GLO_CLIM_TS_V2 product is an improved version of SDC_GLO_CLIM_TS_V1 and contains two different monthly climatologies for temperature and salinity from the World Ocean Data 2018 (WOD-18) database. Along with the basic quality control flags from the WOD-18, an additional quality Control named Nonlinear Quality Control (NQC) is applied. The first climatology, V2_1, considers temperature and salinity profiles from Conductivity Depth Temperature (CTD), Ocean station data (OSD) and Moored buoy data (MRB) along with Profiling Floats (PFL) from 1900 to 2017. The second climatology, V2_2, utilizes only PFL data from 2003 to 2017. V2_1 considers 44 layers from surface to 6000 m while V2_2 only 34 from 0 to 2000 m. The gridded fields are computed using DIVAnd (Data Interpolating Variational Analysis) version 2.3.1. For data access, please register at http://www.marine-id.org/.
-
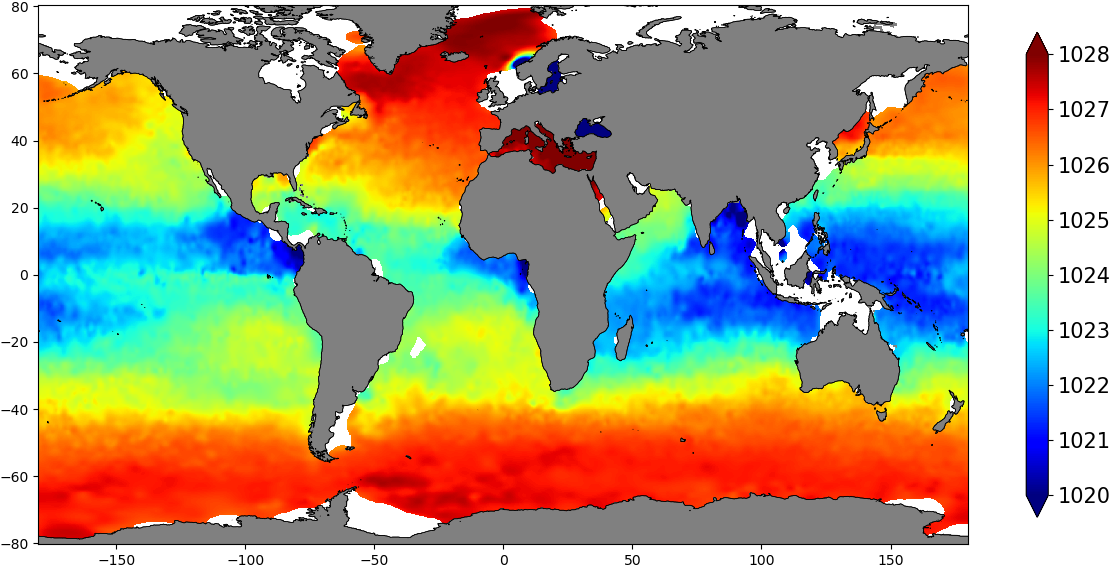
The SDC_GLO_CLIM_Dens product contains global monthly climatological estimates of in situ density using Temperature and Salinity from profiling floats contained in the World Ocean Data 18 (WOD18) database. The profiles were first quality controlled with a Nonlinear Quality control procedure. The climatology considers observations from surface to 2000 m for the time period 2003-2017. Density profiles are computed using UNESCO 1983 (EOS 80) equation from in situ temperature, salinity and pressure measurements by the PFL. Only profiles with both T,S values were used. The gridded fields are computed using DIVAnd (Data Interpolating Variational Analysis) version 2.3.1.
-
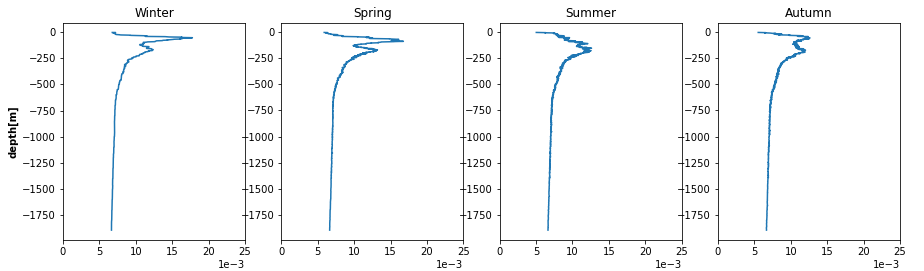
The SDC_GLO_CLIM_N2 product contains seasonally averaged Brunt-Vaisala squared frequency profiles using the density profiles computed in SeadataCloud Global Ocean Climatology - Density Climatology. The Density Climatology product uses the Profiling Floats (PFL) data from World Ocean database 18 for the time period 2003 to 2017 with a Nonlinear Quality procedure applied on it. Computed BVF profiles are averaged seasonally into 5x5 degree boxes for Atlantic and Pacific Oceans. For data access, please register at http://www.marine-id.org/.